课件:点击下载
Python被大量应用在数据挖掘和深度学习领域,其中使用极其广泛的是Numpy、pandas、Matplotlib、PIL等库。
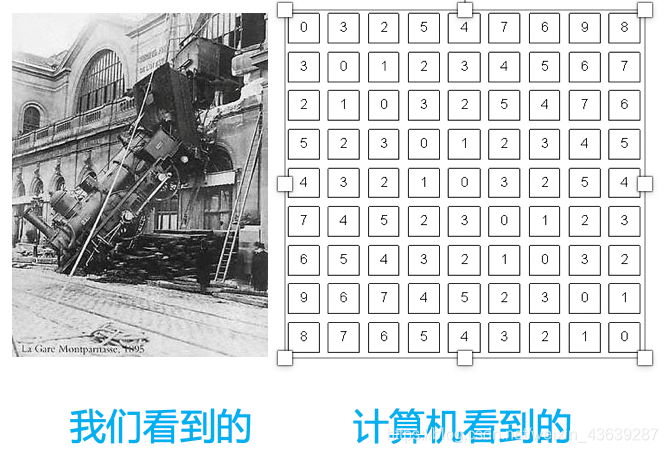
numpy是Python科学计算库的基础。包含了强大的N维数组对象和向量运算。
pandas是建立在numpy基础上的高效数据分析处理库,是Python的重要数据分析库。
Matplotlib是一个主要用于绘制二维图形的Python库。用途:绘图、可视化
PIL库是一个具有强大图像处理能力的第三方库。用途:图像处理
Numpy库
NumPy是使用Python进行科学计算的基础软件包。
更多学习,可参考numpy中文网:https://www.numpy.org.cn/
1.数组创建
可以使用array函数从常规Python列表或元组中创建数组。得到的数组的类型是从Python列表中元素的类型推导出来的。
创建数组最简单的办法就是使用array函数。它接受一切序列型的对象(包括其他数组),然后产生一个新的含有传入数据的numpy数组。其中,嵌套序列(比如由一组等长列表组成的列表)将会被转换为一个多维数组
import numpy as np

#将列表转换为数组
array = np.array([[1,2,3],
                 [4,5,6]])
print(array)
import numpy as np
#将列表转换为数组
array = np.array(((1,2,3),
(4,5,6)))
print(array)下面这样可以吗?
a = np.array(1,2,3,4) 通常,数组的元素最初是未知的,但它的大小是已知的。因此,NumPy提供了几个函数来创建具有初始占位符内容的数组。
zeros():可以创建指定长度或者形状的全0数组ones():可以创建指定长度或者形状的全1数组empty():创建一个数组,其初始内容是随机的,取决于内存的状态
zeroarray = np.zeros((2,3))
print(zeroarray)
onearray = np.ones((3,4),dtype='int64')
print(onearray)emptyarray = np.empty((3,4))
print(emptyarray)为了创建数字组成的数组,NumPy提供了一个类似于range的函数,该函数返回数组而不是列表。
array = np.arange( 10, 31, 5 )
print(array)
输出数组的一些信息,如维度、形状、元素个数、元素类型等
array = np.array([[1,2,3],[4,5,6],[7,8,9],[10,11,12]])
print(array)
#数组维度
print(array.ndim)
#数组形状
print(array.shape)
#数组元素个数
print(array.size)
#数组元素类型
print(array.dtype)
重新定义数字的形状
array1 = np.arange(6).reshape([2,3])
print(array1)


array2 = np.array([[1,2,3],[4,5,6]],dtype=np.int64).reshape([3,2])
print(array2)
2.数组的计算
数组很重要,因为它可以使我们不用编写循环即可对数据执行批量运算。这通常叫做矢量化(vectorization)。
大小相等的数组之间的任何算术运算都会将运算应用到元素级。同样,数组与标量的算术运算也会将那个标量值传播到各个元素.
矩阵的基础运算:
arr1 = np.array([[1,2,3],[4,5,6]])
arr2 = np.ones([2,3],dtype=np.int64)

print(arr1 + arr2)
print(arr1 - arr2)
print(arr1 * arr2)
print(arr1 / arr2)
print(arr1 ** 2)
矩阵乘法:
#矩阵乘法
arr3 = np.array([[1,2,3],[4,5,6]])
arr4 = np.ones([3,2],dtype=np.int64)
print(arr3)
print(arr4)
print(np.dot(arr3,arr4))
矩阵的其他计算:
print(arr3)
print(np.sum(arr3,axis=1)) #axis=1,每一行求和 axie=0,每一列求和
print(np.max(arr3))
print(np.min(arr3))
print(np.mean(arr3))
print(np.argmax(arr3))
print(np.argmin(arr3))
arr3_tran = arr3.transpose()
print(arr3_tran)
print(arr3.flatten())3.数组的索引与切片
arr5 = np.arange(0,6).reshape([2,3])
print(arr5)
print(arr5[1])
print(arr5[1][2])
print(arr5[1,2])
print(arr5[1,:])
print(arr5[:,1])
print(arr5[1,0:2])padas库
pandas是python第三方库,提供高性能易用数据类型和分析工具。
pandas基于numpy实现,常与numpy和matplotlib一同使用
更多学习,请参考pandas中文网:https://www.pypandas.cn/
**Padas核心数据结构:**
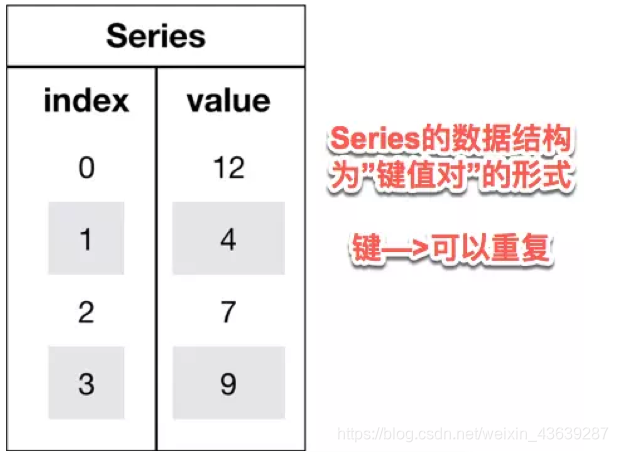
1.Series
Series是一种类似于一维数组的对象,它由一维数组(各种numpy数据类型)以及一组与之相关的数据标签(即索引)组成.
可理解为带标签的一维数组,可存储整数、浮点数、字符串、Python 对象等类型的数据。
import pandas as pd
import numpy as np

s = pd.Series(['a','b','c','d','e'])
print(s)Seris中可以使用index设置索引列表。
与字典不同的是,Seris允许索引重复
#与字典不同的是:Series允许索引重复
s = pd.Series(['a','b','c','d','e'],index=[100,200,100,400,500])
print(s)
Series 可以用字典实例化
d = {'b': 1, 'a': 0, 'c': 2}
pd.Series(d)可以通过Series的values和index属性获取其数组表示形式和索引对象
print(s.values)
print(s.index)
#与普通numpy数组相比,可以通过索引的方式选取Series中的单个或一组值
print(s[100])
print(s[[400, 500]])s = pd.Series(np.array([1,2,3,4,5]), index=['a', 'b', 'c', 'd', 'e'])
print(s)
#对应元素求和
print(s+s)
#对应元素乘
print(s*3)Series中最重要的一个功能是:它会在算术运算中自动对齐不同索引的数据
Series 和多维数组的主要区别在于, Series 之间的操作会自动基于标签对齐数据。因此,不用顾及执行计算操作的 Series 是否有相同的标签。
obj1 = pd.Series({"Ohio": 35000, "Oregon": 16000, "Texas": 71000, "Utah": 5000})
obj2 = pd.Series({"California": np.nan, "Ohio": 35000, "Oregon": 16000, "Texas": 71000})

print(obj1 + obj2)
s = pd.Series(np.array([1,2,3,4,5]), index=['a', 'b', 'c', 'd', 'e'])
print(s[1:])
print(s[:-1])
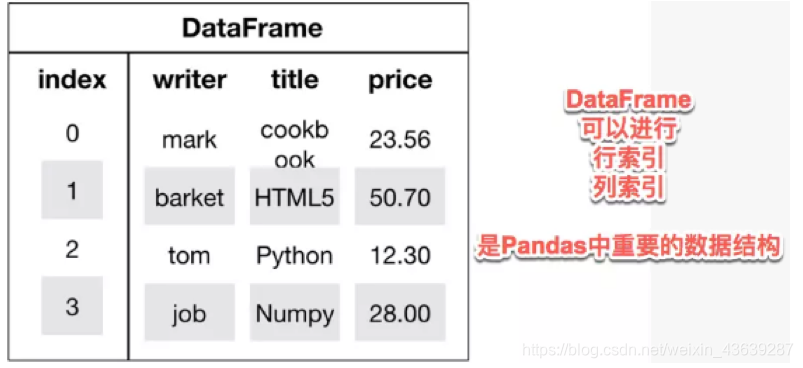
print(s[1:] + s[:-1])2.DataFrame
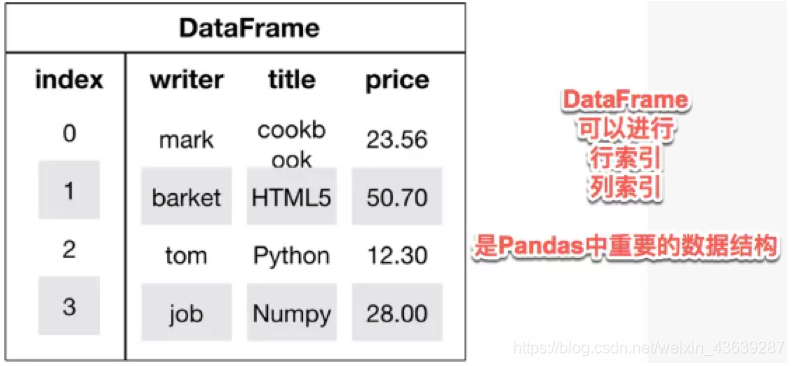
DataFrame是一个表格型的数据结构,类似于Excel或sql表
它含有一组有序的列,每列可以是不同的值类型(数值、字符串、布尔值等)
DataFrame既有行索引也有列索引,它可以被看做由Series组成的字典(共用同一个索引)
用多维数组字典、列表字典生成 DataFrame
data = {'state': ['Ohio', 'Ohio', 'Ohio', 'Nevada', 'Nevada'], 'year': [2000, 2001, 2002, 2001, 2002], 'pop': [1.5, 1.7, 3.6, 2.4, 2.9]}
frame = pd.DataFrame(data)
print(frame)
#如果指定了列顺序,则DataFrame的列就会按照指定顺序进行排列
frame1 = pd.DataFrame(data, columns=['year', 'state', 'pop'])
print(frame1)跟原Series一样,如果传入的列在数据中找不到,就会产生NAN值
frame2 = pd.DataFrame(data, columns=['year', 'state', 'pop', 'debt'], index=['one', 'two', 'three', 'four', 'five'])
print(frame2)
用 Series 字典或字典生成 DataFrame
d = {'one': pd.Series([1., 2., 3.], index=['a', 'b', 'c']),
     'two': pd.Series([1., 2., 3., 4.], index=['a', 'b', 'c', 'd'])}
print(pd.DataFrame(d))
#通过类似字典标记的方式或属性的方式,可以将DataFrame的列获取为一个Series,返回的Series拥有原DataFrame相同的索引
print(frame2['state'])列可以通过赋值的方式进行修改,例如,给那个空的“delt”列赋上一个标量值或一组值
frame2['debt'] = 16.5
print(frame2)
print(frame2)
frame2['new'] = frame2['debt' ]* frame2['pop']
print(frame2)frame2['debt'] = np.arange(5.)
print(frame2)PIL库
PIL库是一个具有强大图像处理能力的第三方库。
图像的组成:由RGB三原色组成,RGB图像中,一种彩色由R、G、B三原色按照比例混合而成。0-255区分不同亮度的颜色。
图像的数组表示:图像是一个由像素组成的矩阵,每个元素是一个RGB值

Image 是 PIL 库中代表一个图像的类(对象)
#安装pillow
#!pip install pillow#展示图片,并获取图像的模式,长宽,from PIL import Image
import matplotlib.pyplot as plt
#显示matplotlib生成的图形
%matplotlib inline
#读取图片
img = Image.open('/home/aistudio/work/yushuxin.jpg')
#显示图片
#img.show() #自动调用计算机上显示图片的工具
plt.imshow(img)
plt.show(img)
#获得图像的模式
img_mode = img.mode
print(img_mode)
width,height = img.size
print(width,height)图片旋转
from PIL import Image
import matplotlib.pyplot as plt
#显示matplotlib生成的图形
%matplotlib inline

#读取图片
img = Image.open('/home/aistudio/work/yushuxin.jpg')
#显示图片
plt.imshow(img)
plt.show(img)

#将图片旋转45度
img_rotate = img.rotate(45)
#显示旋转后的图片
plt.imshow(img_rotate)
plt.show(img_rotate) 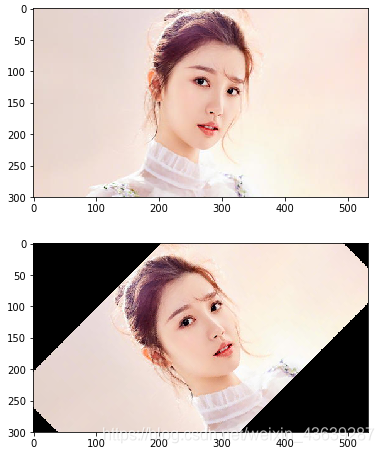
图片剪切
from PIL import Image

#打开图片
img1 = Image.open('/home/aistudio/work/yushuxin.jpg')

#剪切 crop()四个参数分别是:(左上角点的x坐标,左上角点的y坐标,右下角点的x坐标,右下角点的y坐标)
img1_crop_result = img1.crop((126,0,381,249))

#保存图片
img1_crop_result.save('/home/aistudio/work/yushuxin_crop_result.jpg')

#展示图片
plt.imshow(img1_crop_result)
plt.show(img1_crop_result) 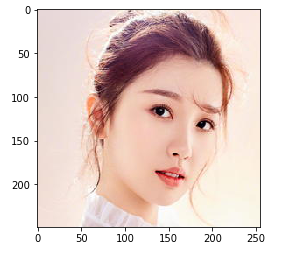
图片缩放
from PIL import Image

#打开图片
img2 = Image.open('/home/aistudio/work/yushuxin.jpg')

width,height = img2.size

#缩放
img2_resize_result = img2.resize((int(width*0.6),int(height*0.6)),Image.ANTIALIAS)

print(img2_resize_result.size)

#保存图片
img2_resize_result.save('/home/aistudio/work/yushuxin_resize_result.jpg')

#展示图片
plt.imshow(img2_resize_result)
plt.show(img2_resize_result)
(319, 180)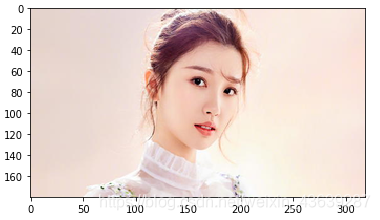
镜像效果:左右旋转、上下旋转
from PIL import Image

#打开图片
img3 = Image.open('/home/aistudio/work/yushuxin.jpg')

#左右镜像
img3_lr = img3.transpose(Image.FLIP_LEFT_RIGHT)

#展示左右镜像图片
plt.imshow(img3_lr)
plt.show(img3_lr)

#上下镜像
img3_bt = img3.transpose(Image.FLIP_TOP_BOTTOM)

#展示上下镜像图片
plt.imshow(img3_bt)
plt.show(img3_bt) 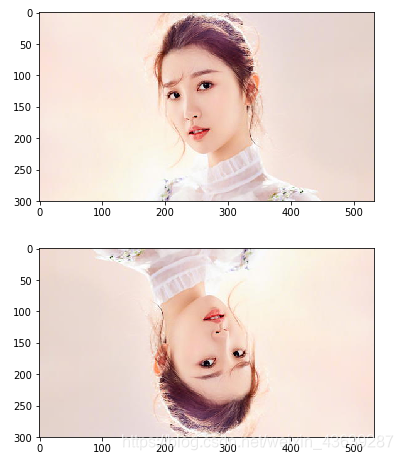
Matplotlib库
Matplotlib库由各种可视化类构成,内部结构复杂。
matplotlib.pylot是绘制各类可视化图形的命令字库
更多学习,可参考Matplotlib中文网:https://www.matplotlib.org.cn
#!pip install matplotlibimport matplotlib.pyplot as plt
import numpy as np
#显示matplotlib生成的图形
%matplotlib inline
x = np.linspace(-1,1,50) #等差数列
y = 2*x + 1
#传入x,y,通过plot()绘制出折线图
plt.plot(x,y)
#显示图形
plt.show()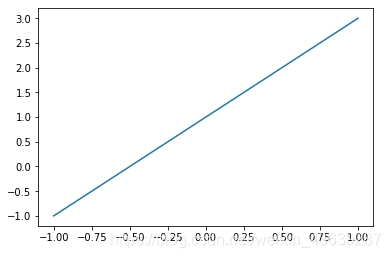
import matplotlib.pyplot as plt
import numpy as np

x = np.linspace(-1,1,50) #等差数列
y1 = 2*x + 1
y2 = x**2

plt.figure()
plt.plot(x,y1)

plt.figure(figsize=(7,5))
plt.plot(x,y2)

plt.show()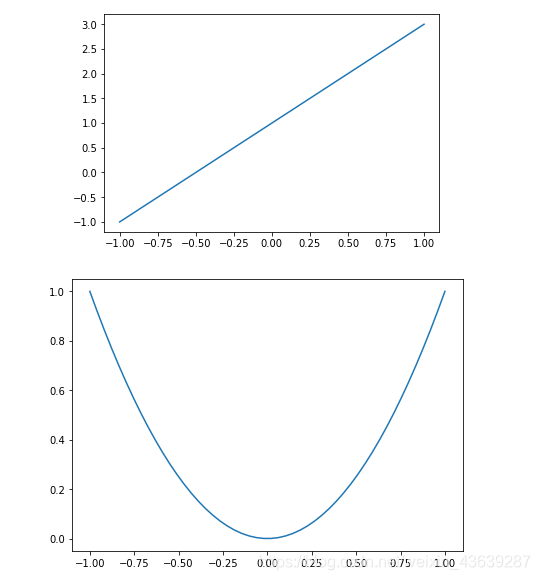
import matplotlib.pyplot as plt
import numpy as np

plt.figure(figsize=(7,5))
plt.plot(x,y1,color='red',linewidth=1)
plt.plot(x,y2,color='blue',linewidth=5)
plt.xlabel('x',fontsize=20)
plt.ylabel('y',fontsize=20)
plt.show()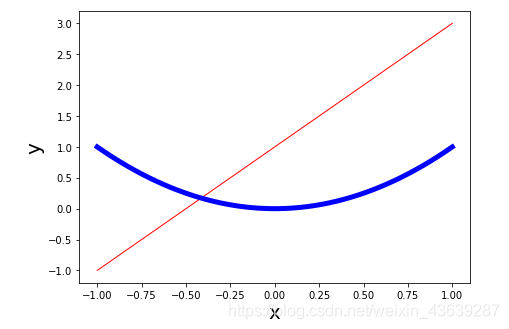
import matplotlib.pyplot as plt
import numpy as np

l1, = plt.plot(x,y1,color='red',linewidth=1)
l2, = plt.plot(x,y2,color='blue',linewidth=5)
plt.legend(handles=[l1,l2],labels=['aa','bb'],loc='best')
plt.xlabel('x')
plt.ylabel('y')
# plt.xlim((0,1))  #x轴只截取一段进行显示
# plt.ylim((0,1))  #y轴只截取一段进行显示
plt.show()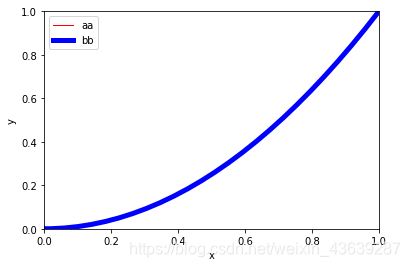
# dots1 = np.array([2,3,4,5,6])
# dots2 = np.array([2,3,4,5,6])
dots1 =np.random.rand(50)
dots2 =np.random.rand(50)
plt.scatter(dots1,dots2,c='red',alpha=0.5) #c表示颜色,alpha表示透明度
plt.show()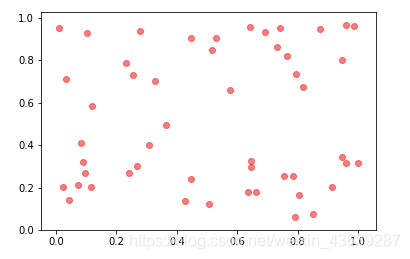
x = np.arange(10)
y = 2**x+10
plt.bar(x,y,facecolor='#9999ff',edgecolor='white')
plt.show()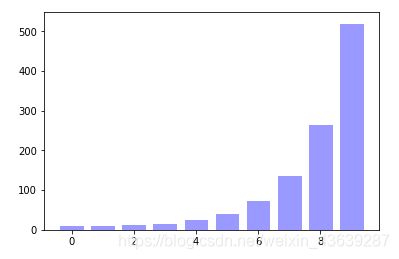
x = np.arange(10)
y = 2**x+10
plt.bar(x,y,facecolor='#9999ff',edgecolor='white')
for ax,ay in zip(x,y):
    plt.text(ax,ay,'%.1f' % ay,ha='center',va='bottom')
plt.show()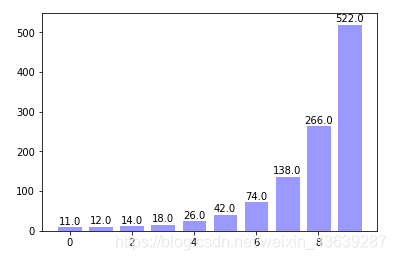
作业:
任务描述:
基于第二天实践使用Python来爬去百度百科中《青春有你2》所有参赛选手的信息,进行数据可视化分析。
# 如果需要进行持久化安装, 需要使用持久化路径, 如下方代码示例:
!mkdir /home/aistudio/external-libraries
!pip install matplotlib -t /home/aistudio/external-libraries
Looking in indexes: https://pypi.mirrors.ustc.edu.cn/simple/
Collecting matplotlib
[?25l  Downloading https://mirrors.tuna.tsinghua.edu.cn/pypi/web/packages/b2/c2/71fcf957710f3ba1f09088b35776a799ba7dd95f7c2b195ec800933b276b/matplotlib-3.2.1-cp37-cp37m-manylinux1_x86_64.whl (12.4MB)
[K     |████████████████████████████████| 12.4MB 245kB/s eta 0:00:01
[?25hCollecting kiwisolver>=1.0.1 (from matplotlib)
[?25l  Downloading https://mirrors.tuna.tsinghua.edu.cn/pypi/web/packages/31/b9/6202dcae729998a0ade30e80ac00f616542ef445b088ec970d407dfd41c0/kiwisolver-1.2.0-cp37-cp37m-manylinux1_x86_64.whl (88kB)
[K     |████████████████████████████████| 92kB 38.2MB/s eta 0:00:01
[?25hCollecting numpy>=1.11 (from matplotlib)
[?25l  Downloading https://mirrors.tuna.tsinghua.edu.cn/pypi/web/packages/e7/38/f14d6706ae4fa327bdb023ef40b4d902bccd314d886fac4031687a8acc74/numpy-1.18.3-cp37-cp37m-manylinux1_x86_64.whl (20.2MB)
[K     |████████████████████████████████| 20.2MB 8.2MB/s eta 0:00:01    |▏                               | 71kB 17.2MB/s eta 0:00:02
[?25hCollecting python-dateutil>=2.1 (from matplotlib)
[?25l  Downloading https://mirrors.tuna.tsinghua.edu.cn/pypi/web/packages/d4/70/d60450c3dd48ef87586924207ae8907090de0b306af2bce5d134d78615cb/python_dateutil-2.8.1-py2.py3-none-any.whl (227kB)
[K     |████████████████████████████████| 235kB 51.2MB/s eta 0:00:01
[?25hCollecting pyparsing!=2.0.4,!=2.1.2,!=2.1.6,>=2.0.1 (from matplotlib)
[?25l  Downloading https://mirrors.tuna.tsinghua.edu.cn/pypi/web/packages/8a/bb/488841f56197b13700afd5658fc279a2025a39e22449b7cf29864669b15d/pyparsing-2.4.7-py2.py3-none-any.whl (67kB)
[K     |████████████████████████████████| 71kB 32.2MB/s eta 0:00:01
[?25hCollecting cycler>=0.10 (from matplotlib)
  Downloading https://mirrors.tuna.tsinghua.edu.cn/pypi/web/packages/f7/d2/e07d3ebb2bd7af696440ce7e754c59dd546ffe1bbe732c8ab68b9c834e61/cycler-0.10.0-py2.py3-none-any.whl
Collecting six>=1.5 (from python-dateutil>=2.1->matplotlib)
  Downloading https://mirrors.tuna.tsinghua.edu.cn/pypi/web/packages/65/eb/1f97cb97bfc2390a276969c6fae16075da282f5058082d4cb10c6c5c1dba/six-1.14.0-py2.py3-none-any.whl
Installing collected packages: kiwisolver, numpy, six, python-dateutil, pyparsing, cycler, matplotlib
Successfully installed cycler-0.10.0 kiwisolver-1.2.0 matplotlib-3.2.1 numpy-1.18.3 pyparsing-2.4.7 python-dateutil-2.8.1 six-1.14.0
# 同时添加如下代码, 这样每次环境(kernel)启动的时候只要运行下方代码即可:
# Also add the following code, so that every time the environment (kernel) starts, just run the following code:
import sys
sys.path.append('/home/aistudio/external-libraries')
# 下载中文字体
!wget https://mydueros.cdn.bcebos.com/font/simhei.ttf
# 将字体文件复制到matplotlib字体路径
!cp simhei.ttf /opt/conda/envs/python35-paddle120-env/lib/python3.7/site-packages/matplotlib/mpl-data/fonts/ttf/
# 一般只需要将字体文件复制到系统字体目录下即可,但是在aistudio上该路径没有写权限,所以此方法不能用
# !cp simhei.ttf /usr/share/fonts/

# 创建系统字体文件路径
!mkdir .fonts
# 复制文件到该路径
!cp simhei.ttf .fonts/
!rm -rf .cache/matplotlib
--2020-04-24 17:07:10--  https://mydueros.cdn.bcebos.com/font/simhei.ttf
Resolving mydueros.cdn.bcebos.com (mydueros.cdn.bcebos.com)... 101.28.131.35
Connecting to mydueros.cdn.bcebos.com (mydueros.cdn.bcebos.com)|101.28.131.35|:443... connected.
HTTP request sent, awaiting response... 200 OK
Length: 9753388 (9.3M) [application/octet-stream]
Saving to: ‘simhei.ttf.2’

simhei.ttf.2        100%[===================>]   9.30M  19.9MB/s    in 0.5s

2020-04-24 17:07:11 (19.9 MB/s) - ‘simhei.ttf.2’ saved [9753388/9753388]

mkdir: cannot create directory ‘.fonts’: File exists
绘制选手区域分布柱状图
import matplotlib.pyplot as plt
import numpy as np
import json
import matplotlib.font_manager as font_manager

#显示matplotlib生成的图形
%matplotlib inline

with open('data/data31557/20200422.json', 'r', encoding='UTF-8') as file:
         json_array = json.loads(file.read())

#绘制小姐姐区域分布柱状图,x轴为地区,y轴为该区域的小姐姐数量

zones = []
for star in json_array:
    zone = star['zone']
    zones.append(zone)
print(len(zones))
print(zones)


zone_list = []
count_list = []

for zone in zones:
    if zone not in zone_list:
        count = zones.count(zone)
        zone_list.append(zone)
        count_list.append(count)

print(zone_list)
print(count_list)

# 设置显示中文
plt.rcParams['font.sans-serif'] = ['SimHei'] # 指定默认字体

plt.figure(figsize=(20,15))

plt.bar(range(len(count_list)), count_list,color='r',tick_label=zone_list,facecolor='#9999ff',edgecolor='white')

# 这里是调节横坐标的倾斜度,rotation是度数,以及设置刻度字体大小
plt.xticks(rotation=45,fontsize=20)
plt.yticks(fontsize=20)

plt.legend()
plt.title('''《青春有你2》参赛选手''',fontsize = 24)
plt.savefig('/home/aistudio/work/result/bar_result.jpg')
plt.show()
No handles with labels found to put in legend.


109
['中国湖北', '中国四川', '中国山东', '中国浙江', '中国山东', '中国台湾', '中国陕西', '中国广东', '中国黑龙江', '中国上海', '中国四川', '中国山东', '中国安徽', '中国安徽', '中国安徽', '中国北京', '中国贵州', '中国吉林', '中国四川', '中国四川', '中国江苏', '中国山东', '中国山东', '中国山东', '中国山东', '中国江苏', '中国四川', '中国山东', '中国山东', '中国广东', '中国浙江', '中国河南', '中国安徽', '中国河南', '中国北京', '中国北京', '马来西亚', '中国湖北', '中国四川', '中国天津', '中国黑龙江', '中国四川', '中国陕西', '中国辽宁', '中国湖南', '中国上海', '中国贵州', '中国山东', '中国湖北', '中国黑龙江', '中国黑龙江', '中国上海', '中国浙江', '中国湖南', '中国台湾', '中国台湾', '中国台湾', '中国台湾', '中国山东', '中国北京', '中国北京', '中国浙江', '中国河南', '中国河南', '中国福建', '中国河南', '中国北京', '中国山东', '中国四川', '中国安徽', '中国河南', '中国四川', '中国湖北', '中国四川', '中国陕西', '中国湖南', '中国四川', '中国台湾', '中国湖北', '中国广西', '中国江西', '中国湖南', '中国湖北', '中国北京', '中国陕西', '中国上海', '中国四川', '中国山东', '中国辽宁', '中国辽宁', '中国台湾', '中国浙江', '中国北京', '中国黑龙江', '中国北京', '中国安徽', '中国河北', '马来西亚', '中国四川', '中国湖南', '中国台湾', '中国广东', '中国上海', '中国四川', '日本', '中国辽宁', '中国黑龙江', '中国浙江', '中国台湾']
['中国湖北', '中国四川', '中国山东', '中国浙江', '中国台湾', '中国陕西', '中国广东', '中国黑龙江', '中国上海', '中国安徽', '中国北京', '中国贵州', '中国吉林', '中国江苏', '中国河南', '马来西亚', '中国天津', '中国辽宁', '中国湖南', '中国福建', '中国广西', '中国江西', '中国河北', '日本']
[6, 14, 13, 6, 9, 4, 3, 6, 5, 6, 9, 2, 1, 2, 6, 2, 1, 4, 5, 1, 1, 1, 1, 1]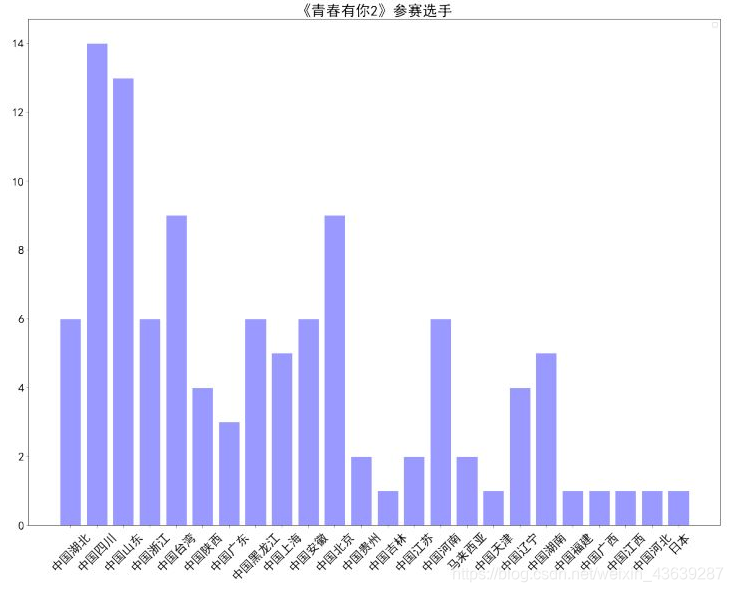
import matplotlib.pyplot as plt
import numpy as np
import json
import matplotlib.font_manager as font_manager
import pandas as pd

#显示matplotlib生成的图形
%matplotlib inline


df = pd.read_json('data/data31557/20200422.json')
#print(df)

grouped=df['name'].groupby(df['zone'])
s = grouped.count()

zone_list = s.index
count_list = s.values


# 设置显示中文
plt.rcParams['font.sans-serif'] = ['SimHei'] # 指定默认字体

plt.figure(figsize=(20,15))

plt.bar(range(len(count_list)), count_list,color='r',tick_label=zone_list,facecolor='#9999ff',edgecolor='white')

# 这里是调节横坐标的倾斜度,rotation是度数,以及设置刻度字体大小
plt.xticks(rotation=45,fontsize=20)
plt.yticks(fontsize=20)

plt.legend()
plt.title('''《青春有你2》参赛选手''',fontsize = 24)
plt.savefig('/home/aistudio/work/result/bar_result02.jpg')
plt.show()
No handles with labels found to put in legend.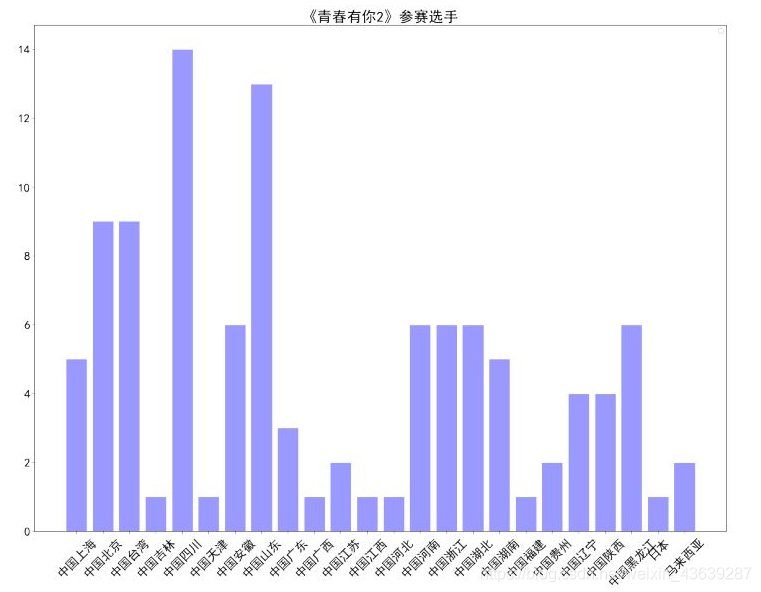
请在下面完成作业,对选手体重分布进行可视化,绘制饼状图
from matplotlib import pyplot as plt
import re
#调节图形大小,宽,高
plt.figure(figsize=(6,9))
#定义饼状图的标签,标签是列表

labels = [u'>55kg',u'50~55kg',u'45~50kg',u'<45kg']

#每个标签占多大,会自动去算百分比
sizes = []


with open('data/data31557/20200422.json', 'r', encoding='UTF-8') as file:
         json_array = json.loads(file.read())

zones = []
SIZE1 = 0
SIZE2 = 0
SIZE3 = 0
SIZE4 = 0
for star in json_array:
    zone_string = star['weight']
    zone_string = re.sub("\D", "", zone_string)
    zone_int = int(zone_string)
    if zone_int > 55:
        SIZE1 = SIZE1 + 1
    elif zone_int >= 50 and zone_int <= 55:
        SIZE2 = SIZE2 + 1
    elif zone_int >= 45 and zone_int < 50:
        SIZE3 = SIZE3 + 1
    elif zone_int < 45:
        SIZE4 = SIZE4 + 1


    zones.append(zone)
print("zones.length= ",len(zones))


sizes.append(SIZE1)
sizes.append(SIZE2)
sizes.append(SIZE3)
sizes.append(SIZE4)


colors = ['red','yellowgreen','lightskyblue','green']
#将某部分爆炸出来, 使用括号,将第一块分割出来,数值的大小是分割出来的与其他两块的间隙
#饼图分离
explode = (0,0,0.1,0)


patches,l_text,p_text = plt.pie(sizes,explode=explode,labels=labels,colors=colors,
                                labeldistance = 1.1,autopct = '%3.1f%%',shadow = True,
                                startangle = 60,pctdistance = 0.6,textprops={'fontsize':18,'color':'k'})

#labeldistance,文本的位置离远点有多远,1.1指1.1倍半径的位置
#autopct,圆里面的文本格式,%3.1f%%表示小数有三位,整数有一位的浮点数
#shadow,饼是否有阴影
#startangle,起始角度,0,表示从0开始逆时针转,为第一块。一般选择从90度开始比较好看
#pctdistance,百分比的text离圆心的距离
#patches, l_texts, p_texts,为了得到饼图的返回值,p_texts饼图内部文本的,l_texts饼图外label的文本

#改变文本的大小
#方法是把每一个text遍历。调用set_size方法设置它的属性
for t in l_text:
    t.set_size=(40)
for t in p_text:
    t.set_size=(30)
# 设置x,y轴刻度一致,这样饼图才能是圆的
plt.axis('equal')
plt.legend()
plt.show()
zones.length=  109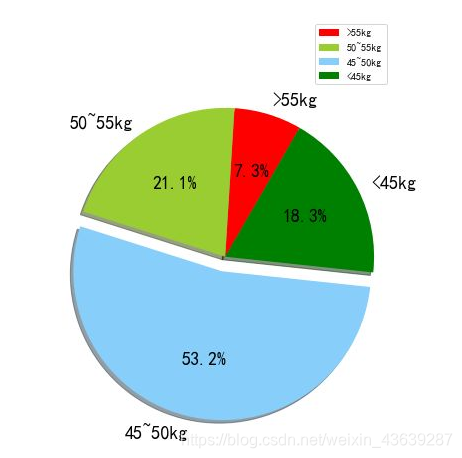
import matplotlib.pyplot as plt
import numpy as np
import json
import matplotlib.font_manager as font_manager
import pandas as pd

#显示matplotlib生成的图形
%matplotlib inline


df = pd.read_json('data/data31557/20200422.json')
#print(df)

weight=df['weight']
arrs = weight.values
# arrs

for i in range(len(arrs)):
    arrs[i] = float(arrs[i][0:-2])


# pandas.cut用来把数组分割成离散的区间。
bin=[0,45,50,55,100]
se1=pd.cut(arrs,bin)

# se1

#pandas的values_counts()函数可以对seriers里面的每一个值进行计数并且排序
pd.value_counts(se1)

labels = '<=45kg', '45~50kg', '50~55kg', '>55kg'
sizes = pd.value_counts(se1)

explode = (0.1, 0.1, 0, 0)

fig1, ax1=plt.subplots()
ax1.pie(sizes, explode=explode, labels= labels, autopct='%1.1f%%', shadow=True, startangle=90)

ax1.axis('equal')

plt.savefig('/home/aistudio/work/result/pie_result02.jpg')
plt.show()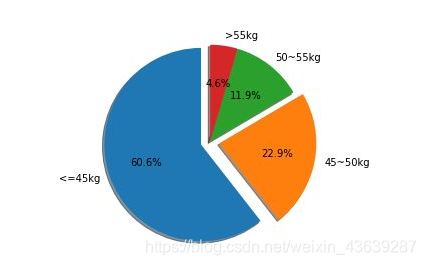
版权属于:soarli
本文链接:https://blog.soarli.top/archives/394.html
转载时须注明出处及本声明。